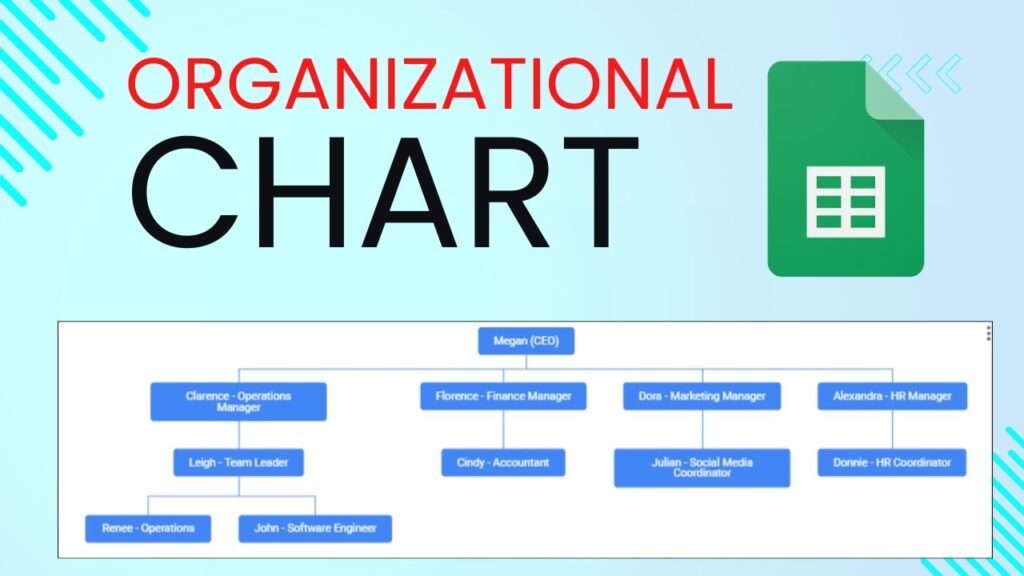
Learn how to create an organizational chart in Google Sheets. Follow these simple steps to visualize your company’s structure efficiently.
30
Minutes
65
USD
Steps to configure the How-to Schema:
Open Google Sheets
Open a new or existing Google Sheets document.
Prepare Your Data
Create a table with two columns:
Column A: Employee names or positions.
Column B: The name or position of each employee’s manager.
Highlight the Data
Select the range of cells containing your data (both columns).
Insert the Chart
Click on “Insert” in the top menu.
Select “Chart” from the dropdown menu.
Choose Chart Type
In the Chart Editor that appears on the right, click on the “Chart type” dropdown.
Scroll down and select “Organizational chart.”
Customize the Chart
In the Chart Editor on the right, click the “Chart type” dropdown.
Scroll down and select “Organizational chart.”
Insert the Chart
Once customized, the org chart will automatically be inserted into your Google Sheets document.
By following these steps, you can easily create an organizational chart in Google Sheets to visualize your company’s structure. Watch the tutorial for a detailed walkthrough on creating an org chart!


